
Decoding Recession Signals: Unveiling Key Indicators from the Household Survey & Job Market Amidst Economic Challenges
Decoding Recession Signals: Unveiling Key Indicators from the Household Survey & Job Market Amidst Economic Challenges


Americans find themselves increasingly exposed to constant gaslighting from the current administration and the quasi-Federal Reserve, asserting that the economy is "strong and resilient." They redefine a 'recession,' downplaying its traditional definition. Amidst the full swing of the 2024 election season, a prominent economic focus is the often touted jobs and unemployment numbers in this supposedly robust time. They argue that "unemployment is sticky," justifying the Federal Reserve's reluctance to cut interest rates thus far. Behind the scenes, however, cracks are appearing in the job market, with emerging recession signals evident in the latest Household Survey data.
Many insiders focus on what is called ‘The Establishment Survey’ which is considered one of the most significant economic indicators to policymakers, economists, & investors to gauge the health of the labor market & broader economic conditions:
The Establishment Survey gathers data from a sample of non-agricultural business establishments, including both private sector and government entities. The primary focus is on collecting information about employment, hours worked, and earnings across various industries and sectors of the economy.
Key features of the Establishment Survey include:
Non-Farm Payroll Employment:
The survey provides a widely watched indicator known as non-farm payroll employment. This metric measures the total number of paid workers, excluding farm employees, private household employees, and nonprofit organization employees.
Industry-Specific Data:
Data collected through the Establishment Survey is broken down by industry and sector, offering insights into job creation or loss across different parts of the economy.
Economic Indicator:
Non-farm payroll employment is a crucial economic indicator, often used to assess the overall health of the labor market and the economy. Changes in employment levels can influence economic forecasts and policy decisions.
Frequency:
The Establishment Survey is conducted monthly. The results are released in the Employment Situation report, providing timely and relevant information on the employment situation in the United States.
Benchmark Revisions:
Periodically, the BLS conducts benchmark revisions to the data, adjusting the estimates based on more comprehensive and accurate information. These revisions help improve the accuracy of the employment data.
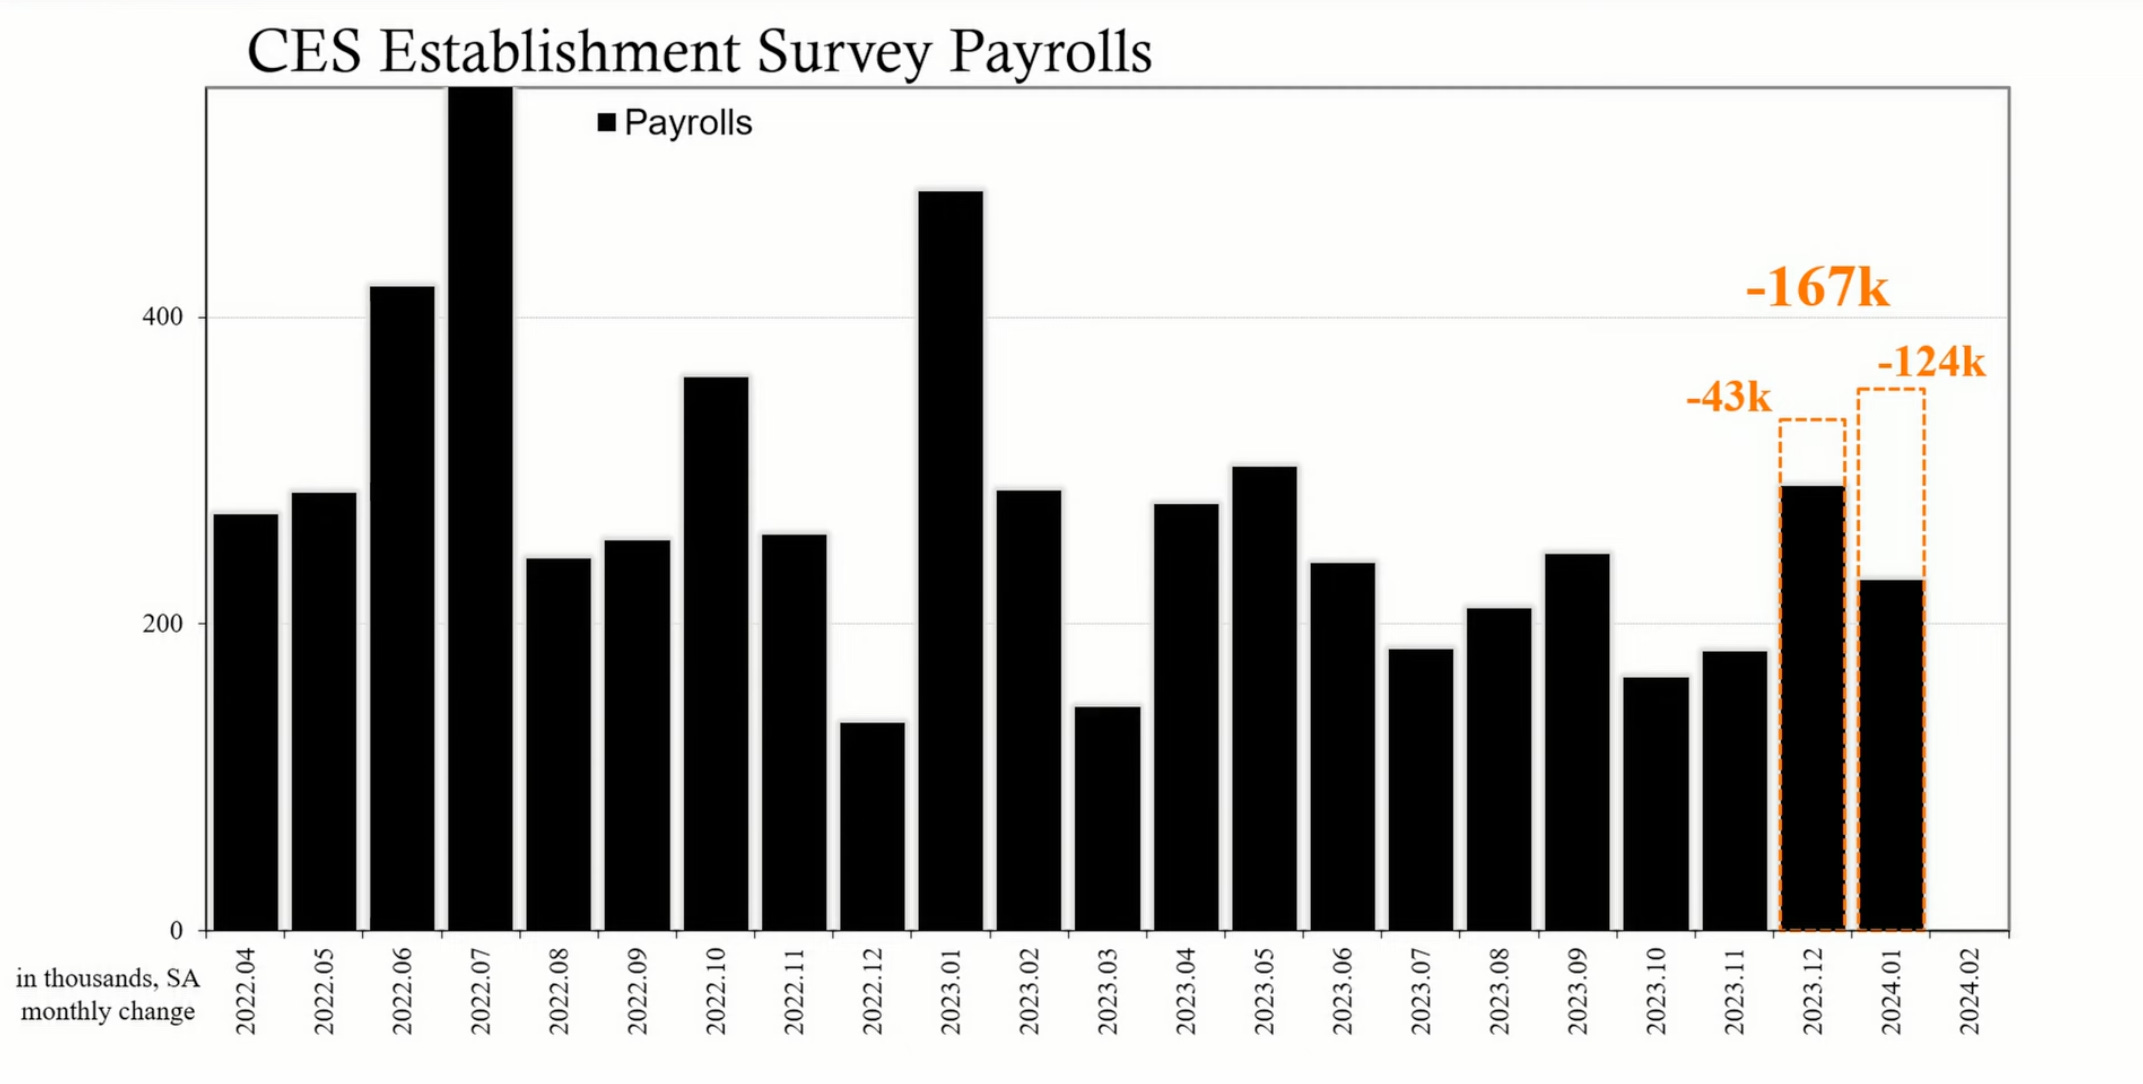
For February 2024, the latest numbers showed non-farm payroll employment rose by 275,000 & the unemployment rate increased to 3.9%. Most of the job gains were in the health care, government, food services, social assistance, & transportation & warehousing sectors.
In the Bureau of Labor Statistics revision process, the initially reported December 2023 employment increase of 333,000 jobs was adjusted downward to 290,000 jobs, reflecting a decrease of 43,000 jobs. Similarly, the initially reported January 2024 employment number of 353,000 jobs underwent a downward revision to 229,000 jobs, a reduction of 124,000 jobs. Altogether, the BLS revisions amounted to 167,000 fewer jobs than originally published. It’s interesting how a large number of employment gains are initially published, blasting expectations out of the water & causing market reactions then…quietly after the fanfare has faded…just kidding, the numbers were really so much lower than we actually stated…oops!
Source: EuroDollar University
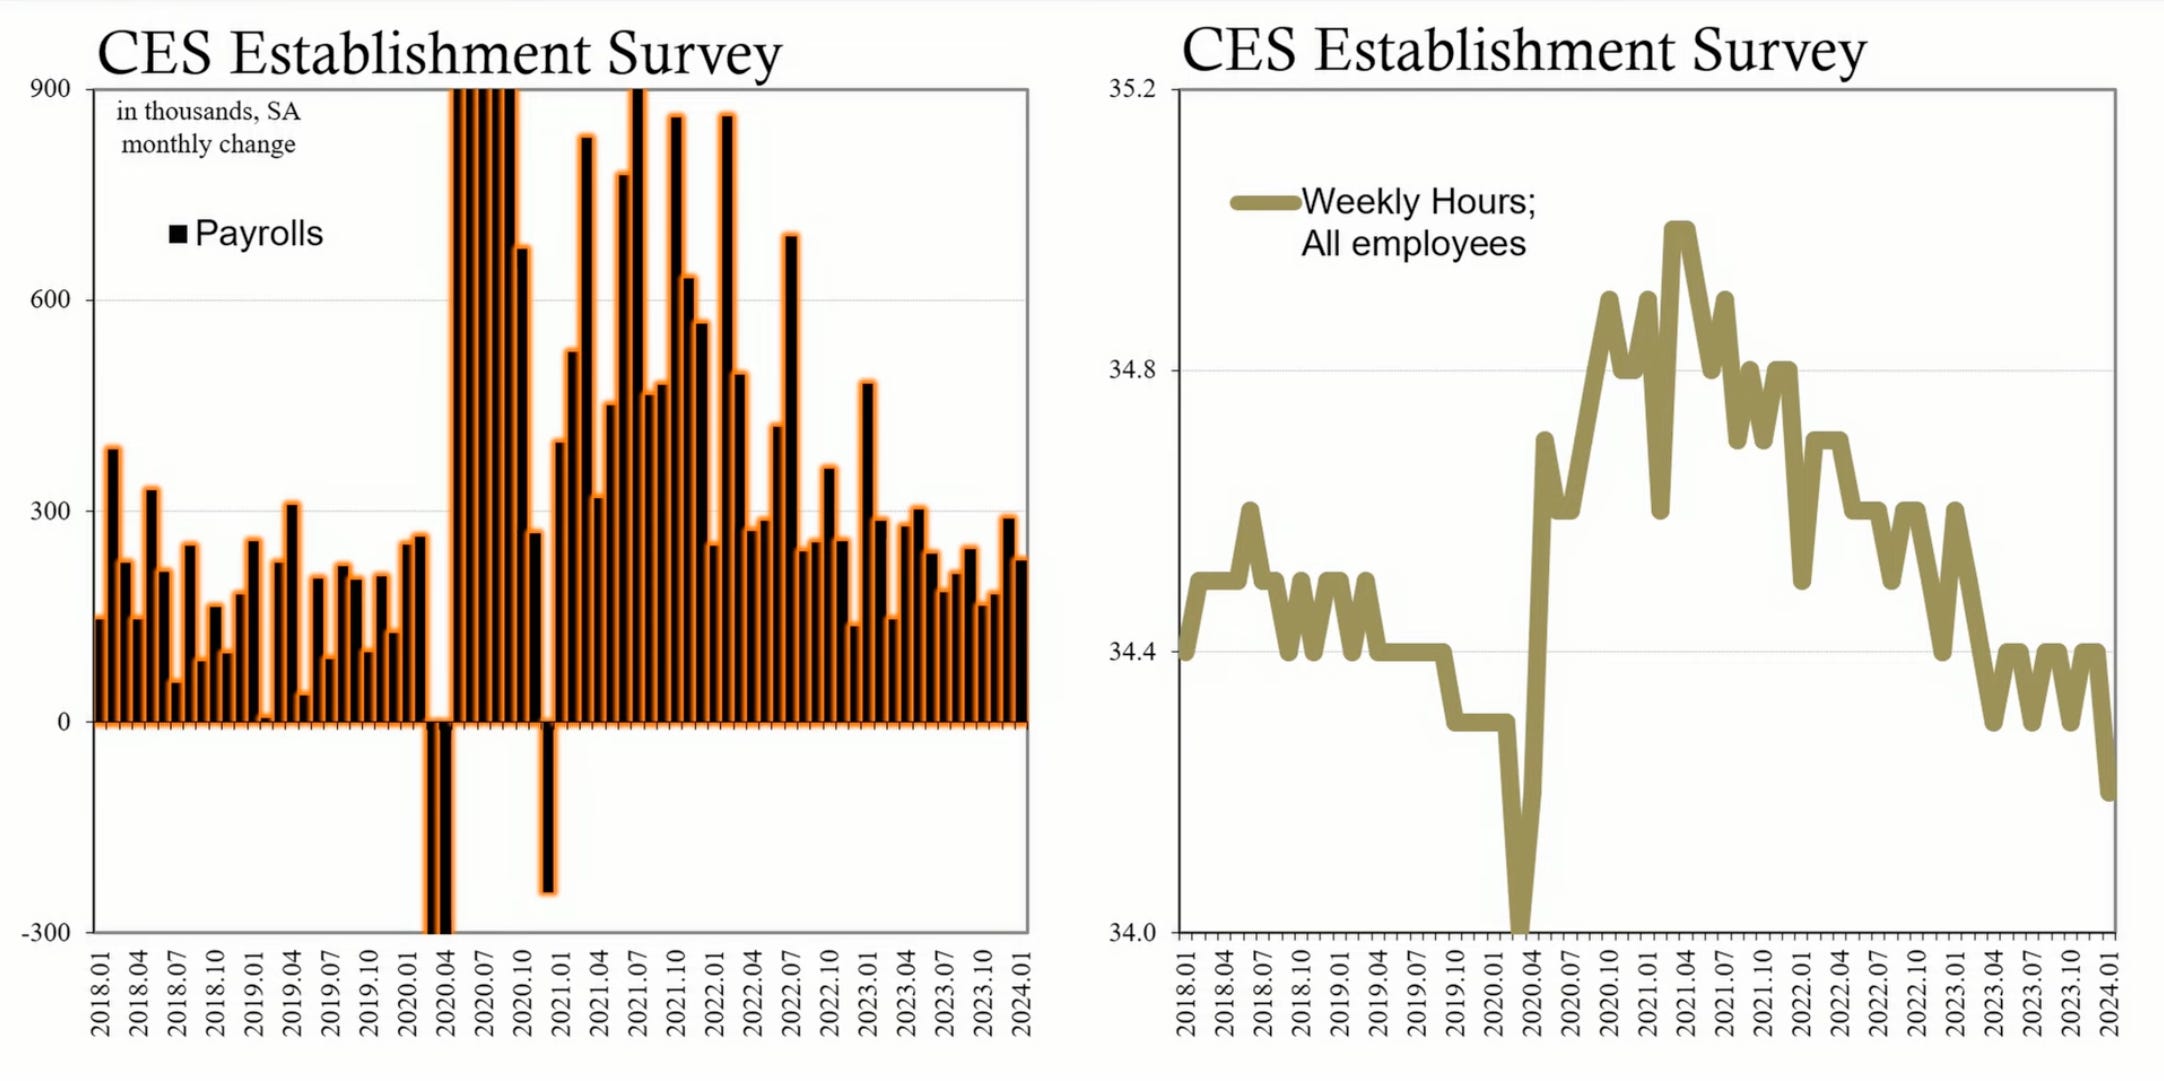
Given the volatility of the Establishment Survey, especially over the past year, it has become a less reliable indicator of economic performance. Not only are the employment numbers revised in the tens to hundreds of thousands, the payroll numbers are showing an inverse relationship with the weekly number of hours employees are actually working which decreased from 34.4 in the latter half of 2023 to 34.2. The constant downward revisions are indicative of a change in the business cycle which closely reflects a recession.
Source: EuroDollar University
The Household Survey which measures labor force status including unemployment by demographic characteristics by asking households how many people are working in the family unit, is displaying three solid recession signals.
Key features of the Household Survey include:
Labor Force Participation:
The survey collects information on individuals aged 16 and older to determine their labor force status, which includes being employed, unemployed, or not in the labor force.
Employment and Unemployment Data:
The Household Survey provides estimates of the total number of employed individuals, the number of unemployed individuals actively seeking employment, and the overall unemployment rate.
Demographic Information:
Demographic details, such as age, gender, race, education level, and occupation, are collected to provide a comprehensive understanding of the labor market characteristics.
Economic Trends:
The survey helps identify trends in employment and unemployment over time, providing insights into the overall health of the labor market and the broader economy.
Alternative Measures of Unemployment:
The Household Survey includes alternative measures of unemployment, such as the U-6 rate, which considers individuals working part-time for economic reasons and those marginally attached to the labor force.
Other Labor Market Information:
Additional information on topics like hours worked, reasons for unemployment, and various employment arrangements (full-time, part-time, temporary) is collected to offer a more nuanced view of the labor market.
Over the course of the past six months, there has been an average loss of 89,000 jobs per month which is a recession signal. To put it into context, going back to the late 1960’s only 14 times does the Household Survey employment go negative for a sustained period of six months, eight of which were outright recessions:
December 1969-November 1970,
November 1973-March 1975,
January 1980-July 1980,
July 1981-November 1982,
July 1990-March 1991,
March 2001- November 2001,
December 2007-June 2009,
February 2020- April 2020
The remaining six, two other six month periods displayed a weakening labor market leading into periods of recession; the summer & fall of 2000 leading into the dot com recession & the summer of 2007 leading into the Great Recession. Two additional six month periods of average negative job losses occurred after recessions in a weak recovery effort; the end of 2002 & the end of 2010. There were only two exceptions to the negative six months of jobs leading into recessions; 2013 when the federal government shut down (nothing to do with the general economy), & the middle of 1995.

Source: EuroDollar University
The second recession signal as indicated by the Household Survey is full-time jobs. In December 2023, the number of full-time jobs decreased by 1.5 million & has been continuing to decline ever since. February 2024 saw a decline of 187,000 full-time jobs. Over the past six months, full-time jobs have decreased by an average of 220,000 per month. Once again, a six month average decline in full-time jobs is highly correlated with recessions with only a few minor exceptions.
The third recession signal as indicated by the Household Survey is the unemployment rate. The February 2024 household numbers showed unemployment rose by 0.2% point to 3.9% with the number of unemployed people increasing by 334,000 to a total of 6.5 million. This was year-over-year increase of .3% & 500,000 people respectively. Although a 3.9% employment rate is relatively low, it is important to note the rate of change in unemployment since April of 2023 of +0.5 percentage points. There have been very few times outside of a recession when the unemployment rate has gone up over a 10-month span but NONE have gone up to 0.5 percentage points without leading to a recession.

Source: EuroDollar University
A fourth recession signal as indicated by the Household Survey is part-time jobs. Although these numbers are less consistent than the aforementioned three indicators, recessions are often indicated by a large increase in part-time jobs. Many non-essential workers are let go & the essential workers experience a decrease in hours available for work. Workers are being converted from full-time to part-time. Over the past nine months the number of full-time jobs lost almost equals the number of part-time jobs gained at 1.8 million & 1.7 million respectively. This mirrors what occurred during the 1981-1982, 2000-2001, 2007-2009 recessions which started out with intersecting numbers & a wide spread of part-time jobs massively exceeding full-time jobs toward the later stages of each recession.
It is predicted that Jerome Powell & the Federal Reserve will attempt to emulate what Alan Greenspan & the Federal Reserve did in 1994-1995 by engineering rates. There were rate hikes from a 3% Federal Funds Rate in January 1994 to 6% in February 1995. Rates were first cut in July of 1995 after nearly six months of weakness in the labor market. Two additional rate cuts were in & in December of 1995 & January 1996 which managed to steer the United States economy away from recession. Alan Greenspan was credited with bringing the economy to a so-called ‘soft-landing’. The economic weakness in 1995 was not as broad as it is displayed by the indicators today.
Given the current recession signals as indicated by the Household Survey; six month average sustained overall job losses, a six month sustained loss in full-time jobs, an unemployment rate of change of 0.5 percentage points, & the replacement of full-time jobs with part-time jobs in combination with a decrease in overall weekly hours worked, it appears we are on the edge of the recession cliff. There are several key outside factors we must consider which will throw a wrench into Jerome Powells attempted emulation of Alan Greenspan’s 1995 ‘magic’:
The United States is Becoming More Involved in WWIII Efforts & isn’t Stopping any Time Soon
The total amount of American military, financial and humanitarian aid to Ukraine since the war started on February 24, 2022, is over $79 billion according to the Kiel Institute for the World Economy, a German research institute that tracks international support for Kyiv. - Newsweek Dec. 2023
The total aid the U.S. will be giving to Israel in 2023 and early 2024 will be about $18 billion. (That’s the $3.8 billion in normal annual aid, plus $14.5 billion in supplemental aid that’s been passed by the House and will surely be passed soon by the Senate.)
The United States is Adding Approximately $1 TRILLION of Debt to its Balance Sheet Nearly Every 100 Days. Current Debt Clock = $34.5 Trillion++
On March 3, 2024, OPEC+ has Agreed to Extend Voluntary Oil Output Cuts of 2.2 Million Barrels per day into the Second Quarter.
Houthi Attacks on Red Sea Shipping Routes & Lack of Sufficient Water Levels in the Panama Canal (36% decrease in ship crossings & $500-$700 million loss in revenue alone) will highly impact the availability of consumer goods & energy supplies.
The Massive Influx of Migrants Placing Strains on Financial Systems & Services
The FAIR study, released in March last year, documented the financial toll of illegal immigration on the U.S., taking into account factors like emergency medical care, incarcerating illegal aliens in local jails, and federal budgets that pay out billions in welfare every year, pegging the net annual cost at $150.7 billion.
Cyberattacks are on the Rise in 2024
A report on cyber security predicted that the cost of cybercrime would reach a massive $9.5 trillion in 2024 and would be in excess of $10.5 trillion in 2025. In the United States alone, an FBI report predicted the potential loss resulting from cyberattacks and fraud to hit over $10.2 billion in 2022. - USA Today

How can my Fellow Warriors Prepare for a Recession?
Build Emergency Savings:
Establish or strengthen your emergency fund. Aim to have at least three to six months' worth of living expenses set aside in hybrid forms. Cash outside of the banking systems, essential bill payment amounts inside the banking system, gold, silver, & Bitcoin. If all systems get hacked, it will be advantageous to stay liquid without reliance on electronic means. Cash & cash equivalents will be king.
Reduce Debt:
Minimize high-interest debt and focus on paying down outstanding “bad debt” such as credit card bills. This can free up resources and provide financial flexibility during challenging economic times. Monitor your credit cards with adjustable interest rates & take advantage of low or no APR balance transfer offers if the math works out to your advantage.
Evaluate and Adjust Budget:
Review your budget and identify areas where you can cut discretionary spending. Prioritize essential expenses and look for ways to save money. Especially since the quality of food & service at restaurants has markedly decreased & the price for even basic fast-food meals has skyrocketed.
Diversify Investments:
Diversify your investment portfolio to spread risk. Consider a mix of asset classes, including treasury bills, commodity & dividend-paying stocks, real estate, and alternative investments that align with your risk tolerance and financial goals.
Secure Income Streams:
Strengthen your employability by acquiring new skills and staying relevant in your industry. Consider diversifying income sources, such as a side hustle or freelance work. Use your downtime to study things you are interested in & learn ways to turn it into a source of revenue.
Assess Insurance Coverage:
Ensure that you have adequate insurance coverage, including health, life, and disability insurance. This can provide a financial safety net in case of unexpected events. I encourage you to look into non-traditional methods such as a health-share plan instead of normal health insurance. A run-of-the-mill basic Obama Care plan can run an individual upwards of $500+ per month! I personally use Christian Healthcare Ministries which covers me in case of emergency.
Network and Stay Informed:
Build and maintain professional & personal networks. Stay informed about industry trends, job market conditions, and economic indicators from reliable & trustworthy sources. There’s no replacing boots-on-the-ground real world data that can often be found in the comments section of YouTube videos on preparedness channels. You’d be surprised at what you will learn. Networking can be valuable during uncertain economic times.
Stay Disciplined:
Stick to your financial plan and remain disciplined in your approach. Avoid making impulsive financial decisions based on short-term market fluctuations. The world’s biggest investors & billionaires have all pulled major liquidity out of the market recently; Warren Buffet, Jeff Bezos, & Mark Zuckerburg have all sold major amounts of shares. For only the “Magnificent 7” companies to dominate the stock market, this bubble is about to pop. Now is not the time to play the Game Stop or AMC meme stock game.
Knowing what lies ahead is not fear mongering, it’s purpose is to help you prepare for the storm. If the storm never comes, you still won’t regret it. There is no substitute for peace of mind during times of chaos.
Until next time my fellow Warriors, stay informed, stay vigilant, Ever Forward!